/chart - Structural chart
★ Premium
/chartrenders a clean structural chart of any coin: candles, levels, formations and density walls on one image.
What it does
/chart produces a candlestick chart (PNG) for a symbol on a chosen timeframe, with volume
profile, formation levels (trendlines, support/resistance) and density walls overlaid, drawn
in your local timezone. It is the visual companion to /ai. Premium feature.
How to use
/chart SOLUSDT
/chart SOLUSDT 1d
- A ticker is required; timeframe is optional (default 15m). Timeframes:
1m 5m 15m 1h 4h 1d.
What you see
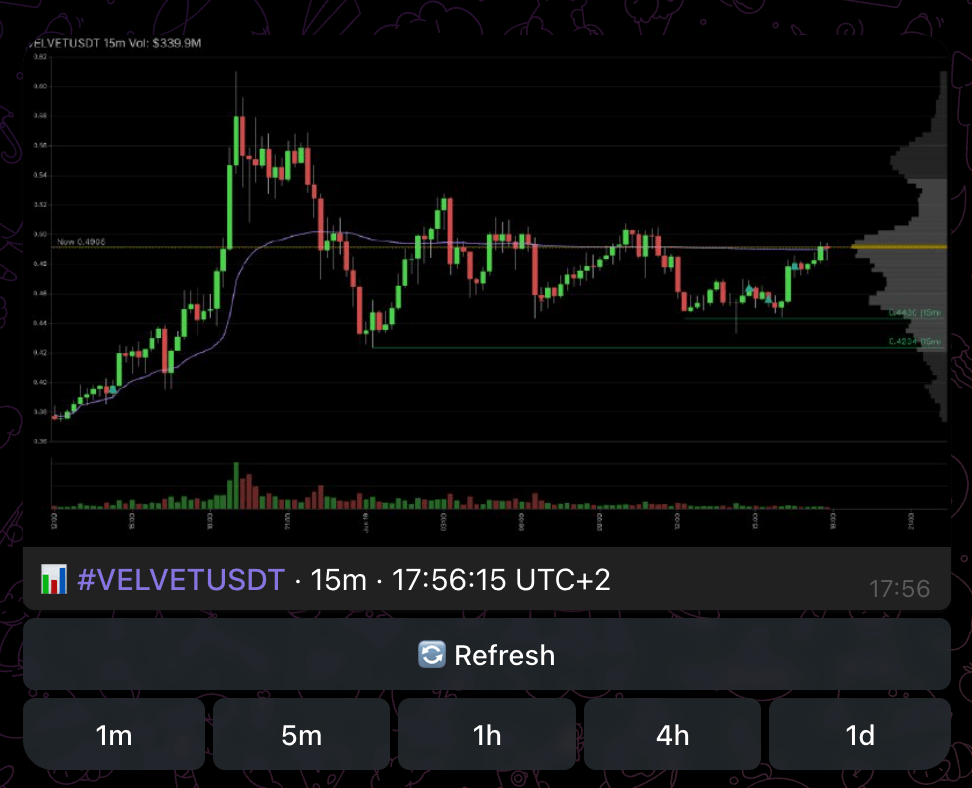
A chart image with a caption (symbol, timeframe, current price and a structure summary), and buttons beneath it:
- 🔄 Refresh - re-render the chart in place with the latest candles.
- Timeframe row -
1m 5m 15m 1h 4h 1d(every timeframe except the current one) redraws the chart on that interval. - ℹ️ Info - the symbol's raw stats.
If a render fails the bot says so and invites you to retry. Refresh has a short cooldown.
Tips
- The same
📊 timeframebuttons appear under pushed signals -/chartis the standalone way to pull one up for any coin. - Use higher timeframes (4h, 1d) to place an intraday setup inside the larger structure.