NextScalp Journal: A Trading Journal You Actually Own
Your broker can tell you what filled and when. It cannot tell you that your win rate collapses after two losses in a row, that one coin is quietly carrying your entire month, or that you keep giving back most of your open profit before you exit. That gap - between a flat list of fills and an honest read of how you actually trade - is exactly what NextScalp Journal exists to close. This is the deep dive: what it is, what its behavioral mirror actually measures, how Exit Lab prices the profit you never kept, and why "self-hosted" is the whole point, not a deployment detail.
Most traders don't lose to the market
They lose to the same handful of habits on repeat, and they cannot see it, because a broker statement is a ledger, not a mirror. The recurring blind spots look like this:
- Tilt after losses. Win rate falls while position size climbs after a losing streak. The fills show neither.
- Hidden concentration. One ticker, one lucky trade - remove it and the edge is gone, but the equity curve hides it.
- Give-back. You were up on the trade and let it bleed back to flat. Nothing in the fill history measures the profit you handed back.
- Broken discipline. Past your daily stop, over your size cap, trading in the hours you swore off. Nothing flags it.
There are SaaS journals that visualize some of this. The trade-off is built into the model: your fills, your P&L, your behavioral patterns, and your strategy all live on someone else's server, behind someone else's login. For a solo trader, that is a real cost - the most sensitive dataset you own, surrendered to see your own habits.
What NextScalp Journal actually is
NextScalp Journal is a self-hosted trading journal and analytics dashboard for Binance USDⓈ-M perpetual futures. You run it on your own server, VPS, or machine; it syncs your fills through read-only API keys and stores everything in your own Postgres database. There is no vendor backend.
The pipeline is one straight line, end to end on your infrastructure:
- Your fills. A read-only sync pulls your Binance futures fills, income, and funding. Read-only means exactly that: it can never place, modify, or withdraw anything.
- Round-trip reconstruction. Scale-ins, partial exits, and add-ons collapse into one real trade per position cycle - entry to flat - with realized P&L computed net of fees and funding.
- 24h context. Each trade is tagged with the coin's 24h volume, how far price had already run before your entry, and its excursion: the maximum favorable move (MFE) and maximum adverse move (MAE) while the position was open.
- Your database. Everything lands in your Postgres. A bundled Docker setup ships the app and the database together, with migrations applied on start.
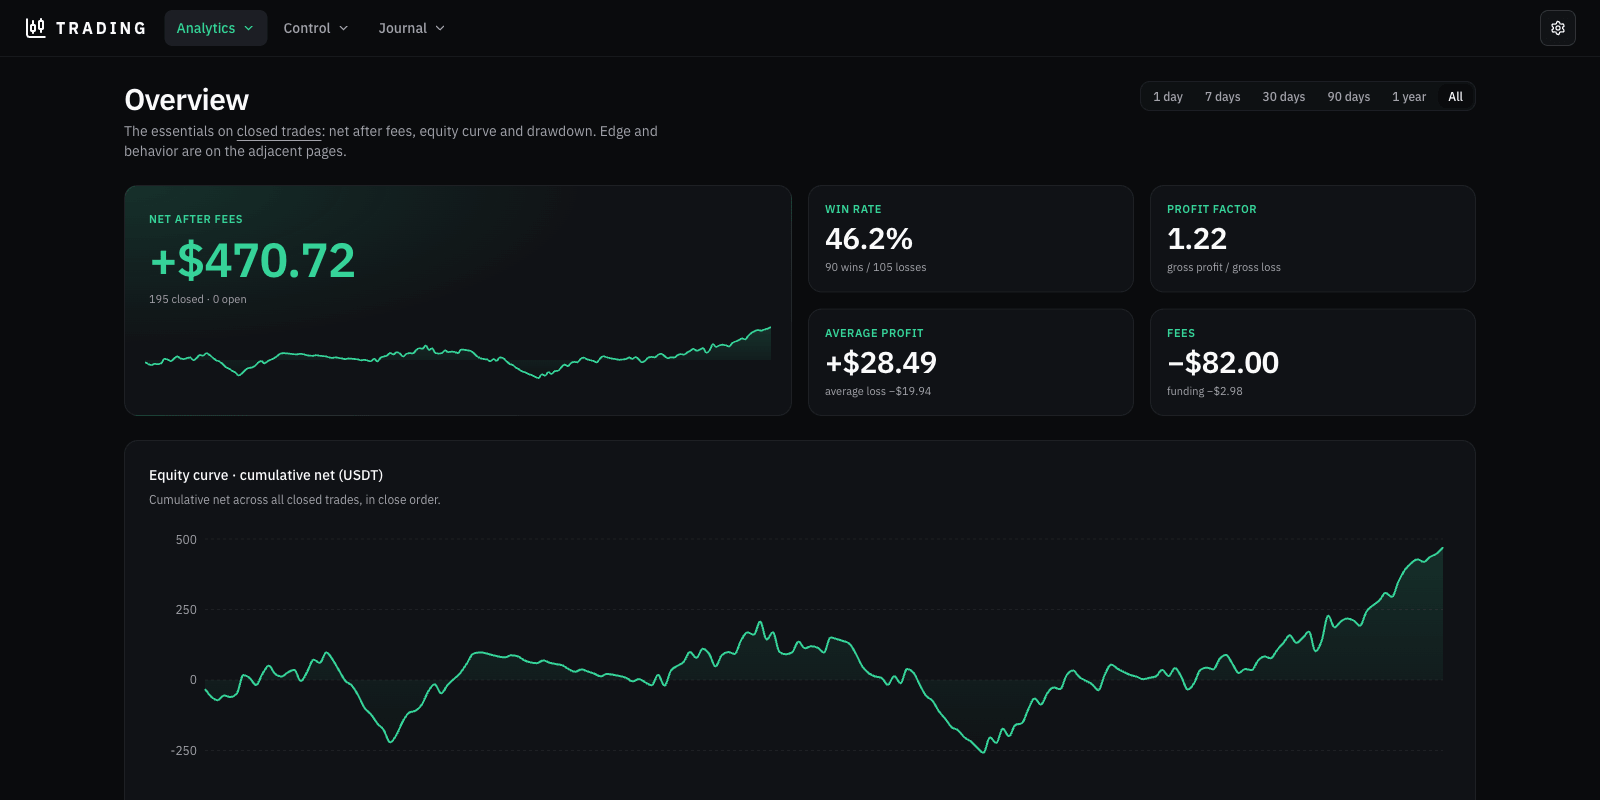
- The dashboard. Server-rendered analytics read straight from your data - your keys and the database client never reach the browser.
The dashboard is organized into Analytics (Overview, Edge, Behavior, Exit Lab), Control (Discipline, AI Coach), and Journal (journal analytics, the trades ledger, and a page per trade), with a shared time-range selector from 7 days to all-time.
The behavioral mirror
Any journal can draw an equity curve. The Behavior page is the product's signature: what the data knows about your habits that you would rather not admit, scored from your own trades and your own journal tags.
Start with the metric most fill histories cannot even express: capture efficiency. Because every trade carries its MFE, the journal knows how much the trade was up at its best moment - and therefore how much of that favorable move you actually kept at the exit. The difference is the give-back:
Around that core, the Behavior page quantifies the habits themselves:
- Revenge and loss add-ons. Runs of back-to-back re-entries into the same symbol where position size grew after a loss - counted, drillable to every entry, with the share that closed red.
- Tilt after a losing streak. The trade you take after N consecutive losses: its average net, average size, and win rate. When size climbs while net falls, that is tilt - not a feeling, a number.
- FOMO and chasing. Net and win rate bucketed by how far price had already moved in your direction over the prior 24h before you entered. Chasing an extended move is the classic FOMO entry, and here it gets its own P&L line.
- P&L by emotion, and planned vs blown losses. Win rate and expectancy by the emotion you tagged on the trade, plus disciplined by-plan losses set against losses taken on greed, FOMO, or tilt.
- R-multiples. Results expressed against your planned risk (entry to stop = 1R), including expectancy in R and the "left on the table" R where you exited before a target price actually reached. If R is new territory, our reward-to-risk guide covers the math.
Discipline, scored outcome-blind
The Discipline page lets you write your own rules and then measures how often - and how expensively - you broke them: max trades per day, a daily loss stop, max consecutive losses, no-trade hours, a position-size cap, and max risk per trade. You set every threshold; it scores every closed trade.
The framing is deliberate and worth stealing even if you never run the product: discipline is measured by the frequency of breaks, not their outcome. A profitable rule-break is variance - you got lucky - not a reason to break the rule. The scorecard counts the violations and the net of the offending trades, and a clean period gets an explicit all-clear.
Exit Lab - the profit you didn't keep
Most journals show what you made. Exit Lab shows what you left on the table at the exit, and which exit rule would have kept it - all replayed on your own trades, never on a model's imagination.
- The give-back tax. The total you were up at the peak of each trade and did not keep, in dollars - shown honestly as a ceiling, since nobody catches the exact top.
- Trade your own plan. If every trade had simply exited at the target and stop you wrote in the journal, what would the book have made? That plan net sits beside your actual net, so you see whether your discretion helped or hurt.
- The fixed-policy sweep. A grid scores every fixed target-and-stop combination over your trades and highlights the best, readable in R or in percent of price.
- The capture curve. How much you would have kept by always taking a set fraction of each trade's favorable move - a simple picture of where holding for more stops paying.
- Per-trade exit replay. On any single trade, drag the target, stop, trailing stop, break-even, and time-stop and watch the outcome recompute live on that trade's real candles. It is a sandbox: nothing is saved, nothing is placed.
Exit Lab is honest by construction. Where a target and a stop were both reachable and the fill order is unknown, it counts the pessimistic case - stop first - and shows the optimistic bound separately. Trades missing the needed data are excluded with a visible count, never guessed.
A journal that links intent to outcome
Every trade carries a journal entry that records why you entered: entry and exit reasons, the setup, the emotion, your planned stop and target, and a free-text lesson. Those tags are what power the behavioral analytics - performance by setup, P&L by emotion, R-multiples - and the product is explicit about the deal: tag your trades and the analytics get sharper; leave them blank and those cuts stay empty rather than guessing.
Two details make the ledger match how scalpers actually work. Assisted journaling suggests tags from data the product already owns - a counter-trend entry, an exit at your written plan, a spontaneous re-entry minutes after a loss - as one-tap chips with a plain-language reason, never auto-applied. And merging folds scale-ins and re-entries into one logical trade, counted once across every metric, with the dashboard spotting likely re-entry series for you; every merge is one deliberate click, reversible with one split.
Each trade also gets its own page with an interactive candlestick chart of the trade window: every fill marked, average entry and exit lines, MFE and MAE levels, and your planned stop and target drawn from the journal. Price action, your fills, your intent, and the outcome - one screen. If you want the manual routine this replaces, our trade-debrief guide walks through it step by step.
Two AI lenses, through your own key
The journal has exactly one feature that ever sends anything off your box, and it is opt-in: AI analysis through your own Anthropic key. Leave the key unset and it simply stays off; everything else runs with no third party.
- The per-trade audit. One tap streams a structured read of a single trade - thesis vs execution, risk, behavior, concrete lessons - grounded in that trade's own numbers, your journal entry, and your discipline rules. It is saved per trade, and you can re-analyze or delete it anytime.
- The AI Coach. The same lens lifted to the week or the month: a review that names your recurring behavioral patterns and ends with a short, concrete list of rules for the next period. The memory loop is the point - when you generate the next review, the coach receives last period's rules and grades your compliance with each one before proposing what to focus on next. Promises made, promises graded, promises revised, all stored in your own database.
Nothing is ever analyzed automatically. That is the same philosophy as NextScalp's own on-demand AI co-pilot: AI as a second opinion you ask for, never a stream you are fed.
Self-hosted vs SaaS journals
The ownership model is the sharpest difference from the journals you have probably tried:
- Where the data lives. SaaS: on the vendor's servers, under their terms. NextScalp Journal: in your own Postgres, on your own machine. There is nothing to leak and no one to trust.
- Access to your account. The sync uses read-only Binance API keys - it cannot place, modify, or withdraw, ever. The dashboard itself is read-only over your analytics; the only writes are the authenticated sync and your own notes.
- Who can log in. A Telegram-id allow-list gates every route. No identity provider, no auth tables, no password database.
- Longevity. A SaaS journal exists as long as the subscription and the vendor do. A self-hosted deploy runs for as long as you keep it running.
- Depth over breadth. It is built deliberately deep for one instrument - Binance USDⓈ-M perpetuals, with funding, 24h context, and 24/7 sessions - rather than shallow for many.
The radar and the mirror
NextScalp and NextScalp Journal are two halves of one discipline. The screener looks forward and outward - at the market, before and during the trade. The journal looks back and inward - at you, after it. The radar finds the trade; the mirror shows what you did with it.
They share the same DNA. The bot grades its own signals with paper trades and refuses to invent a plan when there isn't one; the journal applies that same honesty to you - net of fees, thin samples de-emphasized, concentration surfaced, discipline scored outcome-blind. No flattery in either direction.
How to try it
NextScalp Journal is in active build toward a self-hosted release sold on a subscription - it is not on general sale yet. The full picture lives at journal.nextscalp.com, and two doors are open today:
- The live demo at demo.nextscalp.com - a read-only instance loaded with a realistic few months of trades, every page populated. No account, no keys, nothing to sign.
- Early access - email journal@nextscalp.com with the subject "Early Access request" to get in line for the release.
When it ships, running it is configuration, not coding: a Docker setup with the app and Postgres bundled, your read-only broker keys, your Telegram id on the allow-list, and an optional Anthropic key for the AI features.
The radar finds the trade; the mirror shows what you did with it. Explore the NextScalp Journal live demo - and for the radar side, try NextScalp free for 7 days.